
The unique attributes of vertical flight also comes with some downsides. Aeroplanes have ‘coffin corner’ close to the limits of their flight envelope at high altitude; helicopters have ‘avoid’ areas close to ground where a combination of height and velocity can render them vulnerable in the event of a power loss. Such combination of height (H) and velocity (V) is graphically depicted in the rotorcraft flight manual (RFM) as ‘HV Diagram’. A more ominous epithet for HV diagram is ‘dead man’s curve’.
If an engine quits in flight, potential and kinetic energy is exchanged till a new steady-state is reached. If adequate height and speed are available, the pilot can manipulate controls to arrive at a ‘gate’ condition to execute the final flare and recovery. At low heights and low speeds this energy exchange becomes increasingly difficult; somewhat analogous to base jumping with inadequate height for parachute deployment. This gives rise to an ‘avoid’ area in the HV diagram.
A sample HV Diagram from Bell 206 flight manual (picture for representation only) is shown below:

Another sample from Bell 204B helicopter is shown below:

The concept of ‘avoid’ area
The HV diagram finds mention in every helicopter flight manual (Sea King is an exception, I am told; I couldn’t locate an HV diagram for Sea King Mk-42B or C through my sources). A modern definition of the HV diagram for a medium-twin (AW 139) reads as follows:
“The Height-Velocity diagram defines, in the event of a single engine failure during takeoff, landing or other operation near the surface, a combination of airspeed and height above ground from which a safe single engine landing on a smooth, level and hard surface cannot be assured.”
An alternate definition reads thus: “The height velocity diagram defines the height and airspeed combination that will permit a safe landing in the event of an engine failure”.
There may be minor differences in the technical language of performance, but the essence remains same — certain combinations of H and V should be avoided unless operationally required. It does not preclude operation within the ‘avoid’ zone; rather, it informs crew about the risk of ‘exposure’, so that the time spent within the avoid area is minimised. The determination of HV diagram is done analytically. The analytical model is validated by flight tests that include engine failure, ‘lever delay’ tests and engine-off landings (EOL) where applicable. Such tests are inherently high-risk and undertaken only by experimental test pilots and test engineers.
Engine failure at low heights
One of the skills required to become a helicopter pilot is the handling of a ‘power loss’ situation brought about either due to an engine failure, or any situation requiring engine(s) to be deliberately shut down in flight. The recovery from engine failure on a single-engine helicopter, or transition from ‘all engines operative’ flight (AEO) to one engine inoperative (OEI) flight on a twin/multi-engine helicopter, requires pilot to take specific actions. This will entail lowering the collective lever (with attendant height loss) to preserve rotor speed (RPM, denoted Nr) under most conditions. The Nr decay rate is directly proportional to rotor torque at the instant of failure and inversely proportional to the moment of inertia of the rotor system. Thus, within certain combination of H-V, safe, repeatable recovery from engine failure may not be guaranteed. The locus of such points define the HV diagram. Hover and low speed close to ground is an inauspicious combination for power loss. High speed at low height is another ‘avoid’ combination, for obvious risks of kinetic energy dissipating with high-speed ground contact.
Here’s a standard caution regarding HV diagram found in many twin-engine helicopter RFMs:
“Avoid continuous operation within the avoidance area whenever possible. Power loss or engine failure while operating within the avoidance area is likely to result in damage to the helicopter”.
The ‘avoid’ areas
HV diagrams usually have a set of graphs or shaded areas — one addressing the low speed section, and other dealing with high speed. The point of inflection (where the low-speed trace curves back towards the Y-axis) is called ‘knee’, defined by a combination of minimum safe height (critical height) and forward velocity (critical velocity) below which is a range of heights that should be avoided.
Operating inside the HV diagram’s low-speed avoid section implies inadequate height to safely force land or reject takeoff (RTO), or execute ‘fly away’ for multi-engine helicopters. Operating inside the other section may entail a high-speed touchdown, or even ‘zoom climb’ the aircraft out of ‘gate’ conditions during the recovery process. Continuous exposure to both areas should be avoided unless operationally necessary. The SH-60 RFM notes that “delay in recognition of the single engine failure or excessive manoeuvring to reach a suitable landing area reduces the probability of a safe touchdown.”
HV diagram for single-engine helicopters
Single-engine helicopters operate Performance Class 3, meaning that a ‘force landing’ must be performed in case of engine failure at any point in the flight profile. At low heights, losing an engine can be hazardous for two reasons: If the vertical descent method for recovery is employed, there may be insufficient kinetic energy available in the rotors to cushion the vertical speed below the limiting sink rate of the landing gear. If the conventional flare and recovery method is attempted, there may be inadequate height to reach a suitable speed at which flare becomes effective.

On light singles, expect to find no more than a single HV diagram in the RFM since no ‘fly away’ is possible. Additional systems or ‘box conditions’ for environment control system (ECS), anti-icing, selectable rotor RPM (Nr), etc are also not standard on light singles. Rotor inertia may smoothen the glide somewhat to provide requisite ‘Lever Delay Time (LDT) or Intervention Delay Time (IDT) — pilot reaction time to recognise the condition and start lowering collective. During design, if a low-inertia rotor system is not found capable of providing the regulatory IDT (typically 2 seconds), tip-weights or some other feature may have to be incorporated to improve rotor inertia.
HV diagram for multi-engine helicopters
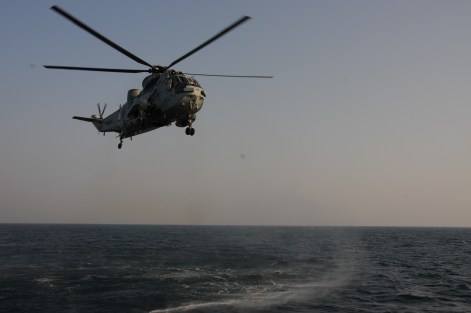
Complete power loss on a multi-engine rotorcraft is very rare, but may be caused due to fuel starvation or contamination, mishandling of engine controls, battle damage, or a (common) driveshaft failure in some designs. It is more practical therefore to focus on OEI at hover. Anti-submarine helicopters that operate dipping sonar spend extended duration inside the ‘avoid’ area. Hence, a judicious height has to be chosen to mitigate the risks while ensuring optimum conditions for the sonar to do its work. Indian Navy’s Sea King Mk 42B for instance hovers at 50 feet while the Russian coaxial Kamov-28 chooses to hover at 25 metres (about 75 feet).
The obvious difference from a single-engine helicopter is that only half the power required is lost; another engine steps up to make good some of the power deficit after OEI. At hover or low speeds, a partial power descent may be chosen over autorotation. Unlike single-engine helicopters, a safe Reject Take Off (RTO) or fly away may even be possible under certain combinations of H and V. The vertical descent method may not be employable beyond a height due to danger of vortex ring state that can develop when rate of descent approximates one half the induced velocity at hover
Contingency power & Category A certification
The other notable difference of twin-engine rotorcraft is a ‘contingency’ power rating that can be invoked during recovery from a single engine failure. This is done by resetting the ‘live’ engine governor to operate at a higher temperature limit, thereby providing a higher power output. That explains the host of HV diagrams in twin-engine RFMs, catering to different weight-altitude-temperature (WAT) conditions, contingency power ratings (there could be more than one), use of engine air bleed, anti-icing, wind conditions, selectable rotor RPM etc. Do check if the published H-V diagram for twin-engine helicopters is applicable for an OEI condition or total power loss; it is usually the former. Simulation and math modelling can be employed for generation of HV data; but actual flight tests of total power loss on medium and heavy twin-engine helicopters is seldom undertaken due safety reasons.
Multi-engine helicopters today, especially in commercial application, are generally certified to Category A specifications, with scheduled performance information and profiles included in the RFM. Such helicopters may therefore operate under performance class 1 or 2. For a Cat A certified helicopter, operating within Cat A regulated takeoff / landing charts and flying to stipulated profiles, there is no HV restriction. The AW139 RFM for instance stipulates that “if the given ambient conditions and weight intercept indicate an H-V avoid area, then low hover and knee points are fixed and the high hover point (HHP) varies according to the conditions and weight.” This could happen when operating performance class 2 on a Cat A certified helicopter. It should be a deliberate decision by the pilot, fully informed of the consequences.

Applicability of HV diagram for emergencies other than power loss
Certain emergencies in helicopter such as loss of tail rotor (TR) or tail drive may call for an intentional power-off autorotation landing. A question thus arises if HV diagram can be used for such emergencies. Complete loss of directional control at hover and low speeds is a decidedly tough combination. Extreme aircraft attitudes, yaw rates and cross-coupled responses may develop within seconds. At the experience and skill level of an average pilot (to which the HV diagram is pegged), it is difficult to estimate the outcome given that no real tests can be performed. The Oct 27, 2018 crash of an AW 169 (G-VSKP) while executing a high-performance, near-vertical takeoff from King Power Stadium, Leicester is a recent, tragic example. The helicopter lost tail rotor control at hover just close to rotation after a Cat A ‘back-up’ takeoff where the height was about 400 feet. The outcome was fatal.
I posed the question of applicability of HV diagram to emergencies other than engine failure to Lee Evans, one of Leonardo’s senior experimental test pilots. He had this to say:
“It would not be prudent to be sitting just outside the single engine (SE) HV avoid area believing that you are also outside of the (tail rotor) TR failure avoid area. It’s certainly true that if you suffer a TR failure on the wrong side of the HV diagram it will probably be catastrophic; therefore an area to avoid prolonged operations, if practicable. However, the SE HV diagram does not indicate the line where a TR failure might be survivable if the correct technique is flown in a timely manner. I would say the long answer is – NO and YES!
NO, because ‘The HV’ diagram used by operators and defined by OEMs is specifically for single engine (SE) failure in single or multi-engine aircraft. It usually incorporates a rotorcraft response time specific to that aircraft/rotor/engine type and a pilot response time, set by safety specifications, to give an Intervention Delay Time (IDT). The HV lines will also be predicated by the recommended technique for that specific emergency. So for an engine failure in a SE helicopter it will use the minimum height loss entry and Constant Attitude or Variable Flare Autorotative landing technique depending on where you are on the HV line at the point of failure (or the Vertical/forward reject if low level). So basically, the HV diagram for a specific type is only for a SE failure in that aircraft type.
YES, theoretically, because another HV diagram could be specifically developed for other emergencies where H and V are a major factor in a safe outcome, like tail rotor emergencies. Although similar to a SE failure in a SE helicopter, the exact IDT and technique would be extremely difficult to define from real-life testing (like it is done for SE failure and CAT A profiles / WAT graphs). It would thus be difficult to define an accurate HV line from real data. Maybe with better simulation and modelling we could do this work but we generally continue to mandate ‘immediate actions’ and best airspeeds to fly in the event of a TR failure.”
That’s a robust explanation. Analytical models or flight testing for HV diagram does not take into account rotorcraft response or pilot response time for catastrophic tail rotor failures at hover or low speeds that are often accompanied by large & rapid changes in aircraft attitude. Large sideslip angles can also develop, increasing pressure error and degrading instrument indications. The fly-away charts would not be applicable as well. Though useful as a rough guide, the HV diagram for single engine failure when read-across for directional control failure (partial or full), in my view, would hide many variables, some of which can give a misleading sense of safety.
Adam Lowes, Chief Rotary Wing Flight Test Instructor at the International Test Pilots School (ITPS), Canada, one of the world’s leading civilian test pilot school, corroborates with this observation: “HV testing specifically allows for forward speed on landing and for the landing gear to absorb some of the landing stresses. And the only reason you can have forward speed is because you have directional control; so the flight test data may not be directly applicable to a tail rotor failure.”
Fly safe!
While it may be human to fly and divine to hover, it is certainly not divine losing an engine at hover or low speeds, especially if it’s the only one you have. So the next time you are planning a hover out of ground effect for rotor track and balance measurements, fixing marker balls on power lines, hooking-up an underslung load, or hovering at any critical combination of H & V, remember to calculate beforehand where your task puts you. Prolonged exposure to ‘avoid’ area of HV diagram can ruin a perfect day if you lose an engine.
Plan well, fly safe. Happy landings!
An edited version of this story was featured in VERTICAL Magazine’s May 2021 issue. You can access the story on page 55 of the magazine here). My sincere appreciation to Lee Evans, Adam Lowes and others who contributed to this article. A big thanks to legendary Sikorsky test pilot Nicholas Lappos who spared valuable time to discuss, with relevant plots & anecdotes, various flight test aspects of this subject.

**********

©KP Sanjeev Kumar, 2021. All rights reserved. Views are personal. I can be reached at realkaypius@gmail.com or on Twitter @realkaypius. Feedback is most welcome.
Disclaimer: If you are a flight crew, please consult national regulations, the Rotorcraft Flight Manual, Pilot’s Operating Handbook (POH) or Aircraft Flight Manual and your company’s Operations Manual as applicable to the type you fly.
Well explained Kips
A good read for all helicopter pilots at any stage
You are right HV cannot really cater to tail rotor failures
In Chetaks I always had this doubt and was very sure that I would not be able to come out of a high hover out of HV in case of TR failure
Did try sometimes but could not get any conclusive learning
Interestingly, and against my opinion, inferences for using ‘Knee Speed’ as Minimum level flight speed has also come up during discussions.
In fact, it won’t be technically correct to employ H-V charts for take off phases, especially if power settings for take-off aren’t defined by OEM; affecting Nr decay. However, it is feasible to determine a safe take off profile with OEM’s recommended power settings (wrt hover), assuming OEI resulting vertical speeds analysis is factored. This being a stretch of acceptability and a ‘boundary line case’ for a technically correct statement, however finds space for greater good.
Thanks for the feedback, Peeush. This is an important point you brought up. For twin-engine helicopters, in my opinion, the correct parameter for deciding reject / continue takeoff after an OEI event should be VToss & not ‘knee speed’. Knee speed doesn’t account for climb performance whereas VToss does. The speeds related to OEI — VToss & Vy — are derived from the ‘power required for level flight’ graph, whereas ‘knee speed’ is derived from HV diagram. The distinction is important. Modern RFMs define specific profiles to be flown for Cat A takeoffs and landings where VToss / VBlss / Vy & the applicability of the same for different ‘segments’ of the recovery to safe OEI flight are clearly defined & inviolable. A good point to be debated in briefing rooms 🙂
Beautifully explained for a lay person and non-flyer aircraft buff like me! Enjoyed reading it and feeling like a bit of real aviation has rubbed off on me… Thanks!
Very well explained
Interesting spin to a routine, but important flight profile in helicopters. Enjoyed it, happy writing and more power to you(r) (pen)!
Wonderful Post
Thanks